Signal integrity design is an important part of PCB design. There are many test methods today. Broadly, they fall into three groups:
- Frequency-domain tests
- Time-domain tests
- Other tests
Not every method fits every case, and many types of instruments are needed. Know the features of each test method, then pick the right method for the object you test. That choice will make verification faster and more reliable.
Time-domain tests
1. Waveform testing
Waveform testing is the most basic signal integrity test. People usually use an oscilloscope. You check waveform amplitude, spikes, edges, and so on. By looking at waveform features you can tell if amplitude, edge time, and other measures meet the spec. Waveform testing must follow some rules so test error stays small.
First, the scope and probe together must have enough bandwidth. The test system bandwidth on the board should be more than three times the test signal bandwidth. In practice, some engineers pick probes at random and mix probes and scopes from different makers. That mismatch can make large errors in the test system.
Second, pay attention to small details. Choose a test point near the receiver. If you cannot probe there, for a BGA part probe a PCB trace or a via close to the pin. If the probe point is far from the receiver pin, the measured signal can differ a lot from the real signal seen by the device. Also keep the probe ground lead as short as possible.
Finally, think about matching. This matters when you use coax cables. The coax into the scope usually ends in a 50 Ω DC-coupled load. Some circuits need a DC bias. If you connect the test system directly, you may change the circuit’s working state and fail to see the correct waveform.
2. Eye diagram testing
Eye diagram testing is a common method for interfaces with formal specs, like USB, SATA, HDMI, and optical links.
You test these interfaces with a scope that supports an eye mask. This can be a general oscilloscope, a sampling scope, or a signal analyzer. These instruments usually have a clock recovery function to build the eye diagram.
If the instrument has no built-in mask or clock recovery, you must use an external clock to trigger.
When you use eye tests, pay attention to how many waveforms you collect. For spec checks, a small sample underestimates jitter. A normal rule is to collect about 3,000 waveforms for a good eye measurement.
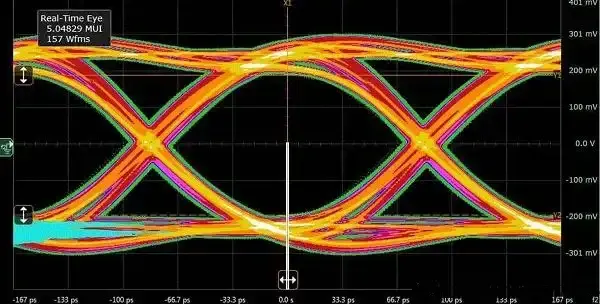
Some tools use analysis software that can show detailed eye results. The software can reveal where sample points enter the mask, which you might not see on a simple display. All sample points add up, so the display looks like a long persistence image.
Newer instruments use long memory storage. They store collected waveforms and let you post-process them. This way each tiny detail remains available and you can find rare anomalies. It helps engineers see whether a pattern is, for example, 10011 or 01001. That feature helps find and fix problems fast.
3. Jitter testing
Jitter testing is getting more attention. Dedicated jitter analyzers such as a TIA (time-interval analyzer) or specialized instruments like the SIA3000 are costly and used less often.
Most labs use an oscilloscope plus software for jitter analysis, for example Keysight’s EZJIT software. The software can separate different jitter components, for example RJ (random jitter) and DJ (deterministic jitter), and further split DJ into its parts.
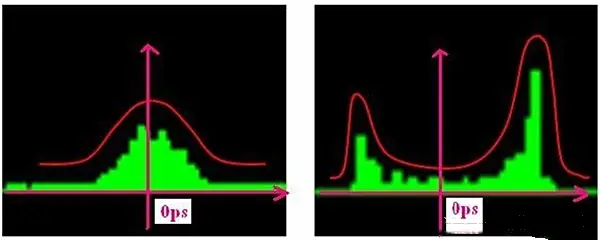
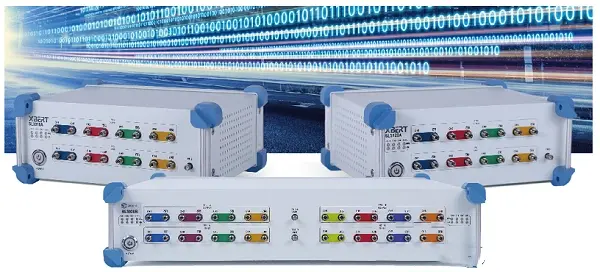
For such tests, the scope should have long record length and very high sampling rate. A memory of 2M points or more and 20 GSa/s sampling rate are common minimal needs.
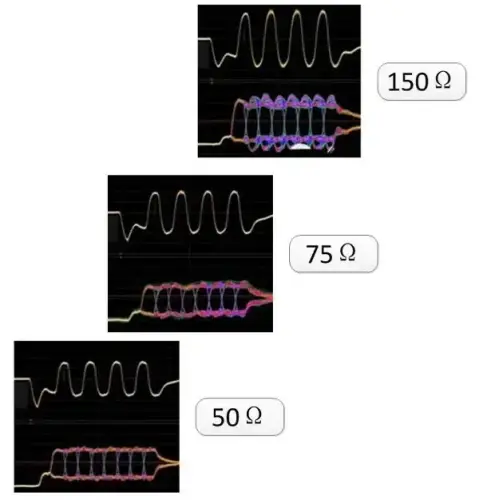
4. TDR testing
TDR (time-domain reflectometry) is used mainly to test PCB traces and device impedance. It works for single-ended traces, differential pairs, connectors, and cables. The test must match the actual application.
For example, if your signal rise time in the real system is about 550 ps, then set the TDR pulse edge close to 550 ps. Do not use a 50 ps edge if the real system edge is 550 ps. A mismatch between test pulse and real pulse can give large differences from real behavior.
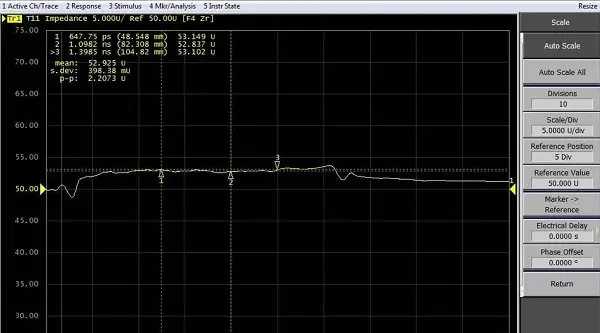
Factors that affect TDR accuracy include read point choice, reflections, and calibration. Reflections can make short PCB trace results very wrong. This is most clear when using a probe tip (TIP) to test, because the TIP contact causes large local impedance changes and strong reflections. Those reflections cause the nearby impedance curve to wobble and produce misleading readings.
5. Timing tests
Device speeds keep rising and timing margins shrink. Timing failures cause product instability, so timing tests are very important.
Timing tests often need a multi-channel scope and probes. Use pattern or state triggers or logic triggers on the scope to quickly capture the target waveform.
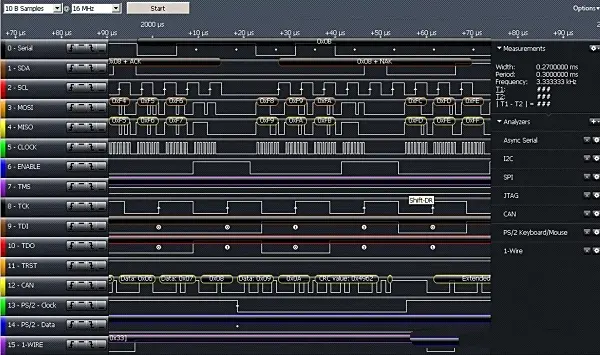
Logic analyzers are not often used for strict timing tests. They are mainly for code analysis — to see which digital pattern runs on a bus and to match it with software. For low-demand uses, a logic analyzer can be used. Compared to a scope, a logic analyzer has more channels but its probes are harder to attach and setup takes more steps.
6. Bit error rate (BER) testing
BER testing is usually a system-level test done with a bit error tester or by software on two PCs. BER tests check each bit over time. Compared to scopes that sample in time, BER test systems measure continuously and catch rare errors. For low BER rates, tests can take a long time — sometimes a day or several days.
Frequency-domain tests
7. Spectrum testing
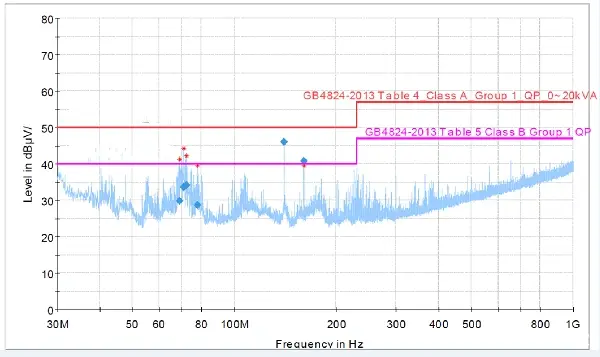
In early design, spectrum tests are rare. Later, for system tests such as EMC, many products must go through these tests. Use spectrum analysis to find frequency points that exceed limits. A near-field scanner with a spectrum analyzer can find which board areas radiate too much.
These devices are expensive and not every lab has them. So in normal work, engineers try to do good matching and shielding in the design phase to avoid EMC failures later.
8. Frequency-domain impedance testing
Many standard interfaces require good impedance match so reflections stay low. In microwave or RF work, impedance has strict needs.
Do frequency-domain impedance tests with a network analyzer. For differential ports the setup is more complex. You often need a balun to transform differential to single-ended, or you use a multi-port network analyzer.
9. Transmission loss testing
Transmission loss testing targets long board traces or cables, or any case of long-distance high-speed signals. It also helps find frequency-domain crosstalk. Use a network analyzer for these tests. For differential signals or twisted pairs, use a balun or a 4-port network analyzer.
Other tests
Practical choices and instruments
In engineering, choose test methods by the object under test and the needs. Some cases call for interface tests such as eye tests, impedance or BER tests. Other simpler boards may use waveform or timing tests. For high-speed designs, use TDR for trace impedance and jitter tests for serial clocks and high-speed serial data.
Many instruments can do several tests. For example, modern oscilloscopes can do timing, waveform, eye, and jitter analysis with software. Network analyzers handle frequency-domain impedance and transmission loss. Use a mix of tools and flexible analysis to improve test efficiency and catch design issues early.
Design scenarios & usage recommendations
Below are practical scenarios and the recommended test methods. Use these as guidance when planning tests.
- Simple digital board, low speed (<100 MHz)
- Use: waveform testing, timing tests
- Instruments: general oscilloscope (100 MHz+), logic analyzer for multi-channel checks
- Why: low-speed signals rarely need TDR or advanced jitter tests.
- Medium-speed digital (100 MHz – 1 GHz)
- Use: waveform, eye for interfaces (if applicable), timing, selective TDR
- Instruments: oscilloscope (1–4 GHz BW), sampling for serial links, TDR for critical traces
- Why: edges and reflections become more relevant; verify impedance and timing margins.
- High-speed serial links (>=1 Gbps, e.g., USB3/PCIe/SerDes)
- Use: eye diagram, jitter decomposition, TDR, BER (system test), frequency-domain loss
- Instruments: high-speed oscilloscope (20+ GSa/s, deep memory), BERT, network analyzer
- Why: both time and frequency domain behaviors are critical for link margin and reliability.
- Very high-speed / RF / microwave
- Use: frequency-domain impedance, S-parameters, transmission loss, EMC pre-scan
- Instruments: vector network analyzer (VNA), spectrum analyzer, baluns
- Why: full frequency response, matching, and radiation need to be characterized.
- Long transmission lines or cables
- Use: transmission loss, TDR, VNA S21/S11
- Instruments: VNA, TDR
- EMC-sensitive designs
- Use: near-field spectrum, pre-compliance scans, layout mitigation
- Instruments: spectrum analyzer with near-field probe set
Test comparisons (quick table)
| Test | Main use | Strengths | Limitations | Typical instruments |
|---|---|---|---|---|
| Waveform | Basic signal shape & edges | Simple, direct | Limited statistical view | Oscilloscope |
| Eye diagram | Link margin for serial interfaces | Shows overall link behavior | Needs long captures, masks | Oscilloscope with clock recovery / sampling scope |
| Jitter | Decompose timing noise | Shows RJ/DJ and sources | Requires high-sampling & memory | Scope + jitter software / TIA |
| TDR | Impedance & discontinuity | Direct view of impedance | Probe reflections can skew | TDR, TDR scope |
| Timing | Multi-channel timing margin | Captures setup/hold issues | Requires many channels | Multi-channel oscilloscope |
| Spectrum | EMC & emissions | Finds radiating sources | Near-field scan equipment needed | Spectrum analyzer + near-field probe |
| Frequency impedance | RF matching | Full freq response | Complex setup for diff ports | VNA |
| Transmission loss | Long line loss vs freq | Real loss curves | Need good calibration | VNA |
| BER | System bit reliability | Captures rare events | Very long test times |